What is the most profitable service for a dentist?
If you’re reading this, you’ve already asked the core question: what is the most profitable dental service for a dentist in 2025? That question matters because the right answer transforms schedules, hiring, capital allocation and – most importantly – patient care. This guide combines industry benchmarks from 2023–2025, practical examples, and hands-on worksheets you can use to test ideas in your practice.

Why this question matters more than ever
Overhead consistently hovers near 60–65% of collections for many U.S. general practices. After overhead, net margins often fall in the 30–40% band. Those headline numbers tell you two things: one, capacity and service mix directly affect what’s left at the bottom line; and two, a handful of strategic changes can significantly shift your realized profit. When you ask which is the most profitable dental service, you’re really asking which service mix best converts production into take-home profit at your practice. Industry benchmarks such as the 2025 Dental Industry Outlook help frame realistic expectations.
Top contenders: quick snapshot
Here’s a short list of service categories that regularly show up as top margin drivers in contemporary practice benchmarking:
- Hygiene and recare — steady revenue, low variable costs, high predictability.
- Dental implants — high revenue per case; needs capital and skill.
- Clear aligner orthodontics — high-ticket, predictable payments, needs workflow efficiency.
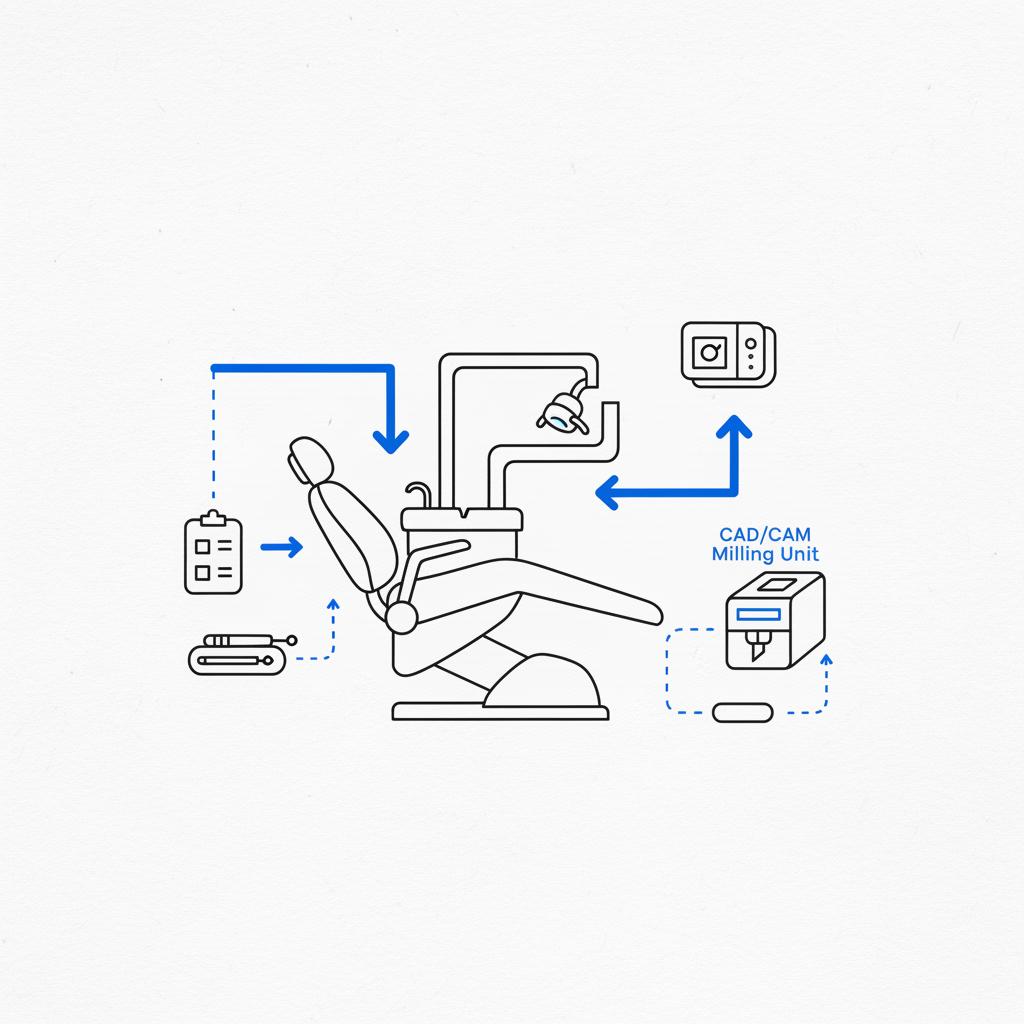
- Restorative crowns & CAD/CAM same-day workflows — improved margins when labs are reduced.
- Endodontics & simple oral surgery — profitable when retained in-house.
- Cosmetic services — veneers and whitening can be profitable if acquisition cost is low.
All of these can be winners — the trick is understanding your practice’s fit and the incremental contribution after overhead. For broader industry statistics and market context, see this summary of dental practice industry statistics.
How to think about profitability: a simple framework
Profitability is not simply revenue per case. Use this framework:
- Expected revenue per case — realistic fee you expect to collect.
- Direct costs — lab fees, materials, outsourced production.
- Chair time — the hours the operatory is occupied.
- Capital outlay — equipment, training, depreciation.
- Marketing and acquisition — ad spend and conversion costs.
- Hidden opportunity cost — what else could that chair be doing?
Calculate contribution margin per clinical hour and you’ll start to see patterns. For many practices, the service that yields the highest incremental margin per hour — and is repeatable given demand — becomes the operationally most valuable. That is often the most profitable dental service in practice, not just on paper.
Tip: If you need help mapping demand and realistic ROI timelines, a gentle external check can speed clarity. Ask for a conversation with Agency VISIBLE to examine demand signals and patient acquisition costs for elective services — it’s a practical way to validate whether a high-revenue service will translate into net profit in your market.
A close look at each service category
Hygiene & recare: the reliable backbone
Hygiene rarely headlines as glamorous, but it often forms 25–35% of a practice’s production and supports the entire schedule. Because materials for prophylaxis are inexpensive and chair time is predictable, hygiene frequently yields a strong contribution margin per hour. When you scale hygiene capacity intelligently — add an extra hygiene chair, stagger appointments, or empower hygienists with expanded preventive services — you can increase total practice production with lower variable costs. For many practices, boosting hygiene volume is the quickest and least risky path to improving the bottom line.
Dental implants: high reward, higher complexity
Implants can bill anywhere from $3,000 to $6,000+ per case depending on complexity and restorative demands. That headline revenue makes implants look like the clear winner, and in many practices they are. But implant programs require capital (surgical kits, CBCT imaging, regenerative materials), training time and careful case selection. If the practice can keep restorative crowns and final prosthetics in-house, implant pathways tend to deliver stronger net margins. If you’re considering implants, run a conservative volume projection: how many completed implant restorations will you realistically finish each month? Then model lab and prosthetic costs, surgical time and the marketing needed to attract suitable candidates. If the numbers look promising, implants often become the single highest-margin elective service — but only when protocols, scheduling and restorative integration are solid. For clinic performance benchmarks related to implants, see this review of dental implant clinic metrics.
Clear aligner orthodontics: predictable, scalable, team-friendly
Clear aligners are prominent on many 2025 lists of high-margin services. Reasons include predictable payment plans, relatively standardized treatment workflows, and growing patient demand. The margin outcome depends on workflow efficiency: use auxiliaries and hygienists for routine check-ins and retain the dentist for critical milestones to reduce chair time per case. Practices that scale aligner therapy with delegated monitoring and digital workflows usually find aligners to be among the top contributors to profit — provided third-party aligner costs and digital setup fees are carefully managed.
Restorative crowns & CAD/CAM: same-day convenience that pays off
Traditional crowns have material and lab fees that squeeze margins. In-office CAD/CAM systems change that calculus: they reduce lab dependance, cut turnaround time and often raise patient acceptance for single-visit crowns. The capital payback can be compelling when restorative volume is high; some practices pay down CAD/CAM investment in 18–36 months with proper scheduling and pricing. If you’re tracking the most profitable dental service in restorative categories, dental crowns produced in-house with efficient CAD/CAM workflows often top the list.
Endodontics & simple oral surgery: reclaiming referral leaks
Many general practices refer out root canals and surgical extractions, losing both revenue and control of the patient journey. Bringing endo or simple surgeries back in-house can turn referral losses into high-margin production lines. Typical benefits include higher per-case revenue retained by the practice and improved patient retention through continuity of care. To succeed, ensure proper training, equipment and efficient scheduling so cases don’t bottleneck the schedule.
Cosmetic dentistry: high-ticket but marketing-sensitive
Veneers, smile makeovers and whitening can be lucrative, but their profitability hinges on patient acquisition. If you must buy most of your cosmetic cases with paid ads, acquisition costs can reduce margins dramatically. Cosmetic services shine when marketed to an existing patient base through retention marketing, in-office offers and patient journey nudges. That’s why cosmetic offerings are often best considered a strategic premium for practices with a strong internal conversion funnel.
Case studies that illustrate the point
Same-day crowns: a dramatic margin lift
A suburban practice implemented CAD/CAM after running a six-month financial projection. They previously sent 80% of crowns to external labs and experienced long turnaround times that chased patients away. By bringing milling in-house, they reduced lab fees, increased chair turnover for crowns and improved patient satisfaction. Their crown margins rose enough to justify the capital in under two years – a clear example of how technology plus volume can make restorative services the most profitable dental service in a practice. You can find related case work on the Agency VISIBLE projects page for practical examples of workflow-driven outcomes.
Endo retention: reclaiming high-margin procedures
A two-doctor practice added same-day root canals in the general chair and trained assistants to handle sterilization and prep. Previously, those cases were referred out, and the practice lost both revenue and follow-up restorative work. After three months, endodontic procedures became one of their top margin drivers — with the added benefit that restored patients returned for crowns and other restorative care.
Modeling profit: step-by-step checklist
Run this simple ROI checklist for any service you’re considering:
- Estimate average revenue per accepted case (conservative figure).
- Subtract direct costs: lab fees, materials, outsourced production.
- Estimate chair time per case and calculate contribution per clinical hour.
- Allocate capital outlay and depreciation into monthly cost per chair hour.
- Estimate monthly cases realistically based on local demand.
- Factor in marketing and patient acquisition costs per accepted case.
- Calculate net contribution and compare with alternative uses of the chair.
When you ask which is the most profitable dental service, the checklist will often show that the answer depends on contribution per chair hour and realistic case volume in your market.
For many practices, expanding hygiene capacity or optimizing hygiene scheduling provides the quickest and least risky profit improvement because hygiene requires minimal capital, has low variable costs and produces steady, predictable revenue.
Scheduling, staffing and delegation: the hidden levers
Profitability depends heavily on how you schedule and delegate. Consider these operational changes:
- Use block scheduling to cluster similar procedures and reduce setup time.
- Delegate routine aligner checks and prophylaxis education to hygienists.
- Cross-train assistants for both restorative and surgical setups.
- Use templated appointment types with realistic chair times informed by historical data.
Staffing models that emphasize delegation and clear role boundaries often unlock the margin potential of high-ticket services while preserving patient experience.
Marketing and acquisition: don’t underestimate true cost
High-ticket elective services look profitable on paper, but acquisition costs can make or break ROI. Track the full cost per accepted case — not just ad spend. That means measuring lead quality, conversion rates, and the average number of touches needed to convert an existing patient or a new lead. Practices that prioritize internal marketing — patient newsletters, in-office offers and recall nudges — often convert cosmetic and elective services with far lower acquisition cost than paid channels. If paid channels are necessary, monitor cost per accepted case closely and compare it to your contribution margin calculations. A simple logo helps recognition.
When to outsource marketing help
Small and mid-sized practices often lack the time and bandwidth for sophisticated acquisition tracking. If that’s you, consider tactical outside help. A brief strategic engagement can clarify which services to promote to your patient base and which ads to test. For a quick, professional audit of your acquisition funnel and to create a conversion-oriented plan, a conversation with a firm like
Agency VISIBLE can reveal whether your expected cosmetic or aligner revenue will survive real-world acquisition costs — without a heavy agency retainer.
Technology investment: align tools with demand
Technology often improves margins but only when used in the right situations. Consider this shortlist:
- CAD/CAM systems — best when restorative volume is high.
- CBCT and guided surgery tools — valuable if you’ll run consistent implant volume.
- Digital scanners and aligner integrations — useful for efficient orthodontic workflows.
Run an equipment ROI with conservative case projections. If tools align with predictable demand and you can train staff to maintain throughput, technology can be a multiplier for margin. Otherwise, it becomes a costly paperweight.

Common pitfalls and how to avoid them
Watch out for these traps:
- Buying expensive tech before you have volume to justify it.
- Underestimating training time and lost production during ramp-up.
- Ignoring the full cost of acquisition for elective services.
- Failing to update scheduling templates after adding new procedures.
These mistakes turn promising services into margin drains. A small pilot with careful measurement often prevents them.
Real numbers: an example worksheet
Use this quick worksheet to compare two potential service additions: adding an extra hygiene chair vs. launching a small implant program.
Scenario A — Extra hygiene chair (monthly)
- Average production per hygiene visit: $120
- Visits per chair per day: 6
- Working days per month: 20
- Monthly production: $120 x 6 x 20 = $14,400
- Variable costs: $120/month supplies per day approximated at $2 per visit = $240
- Contribution before overhead: $14,160
Scenario B — Small implant program (monthly)
- Average revenue per implant case (restorative included): $4,200
- Cases per month realistically: 4
- Monthly production: $16,800
- Direct costs (materials, prosthetic lab): $1,200 per case = $4,800
- Contribution before overhead: $12,000
- Capital amortization and imaging costs may reduce monthly contribution further.
Which is the most profitable dental service here? The hygiene chair offers predictable, low-effort contribution and similar total production with fewer capital requirements and less marketing risk. The implant program may exceed production, but it carries higher upfront costs and demand risk. Both can be right for different practices; the worksheet shows how to decide rationally.
Leadership and team alignment: the people side of profit
Introducing new services without buy-in creates friction and reduces quality. Use these steps to build alignment:
- Communicate the business case clearly to the team.
- Map new workflows and run a two-week pilot before full launch.
- Invest in targeted training and create checklists for new procedures.
- Reward performance using measurable KPIs like case acceptance and contribution per hour.
Team alignment reduces the hidden costs of adding services and increases the likelihood that the chosen service becomes the operationally most profitable dental service for your practice.
Regional and payer considerations
Payer mix, local fee schedules and competition change the math. Coastal, affluent markets often support elective high-ticket services; rural markets may reward volume and in-house restorative care. Understand your payer mix: commercial insurance, Medicaid/Medicare, or private-pay patients each influence what services will realistically drive profit in your setting.
Measuring success: KPIs to track monthly
Track these to ensure your new service is delivering as expected:
- Contribution margin per clinical hour
- Case acceptance rate
- Average revenue per active patient
- Cost per accepted case (marketing)
- Utilization rate per operatory
Regular review allows you to tweak price, scheduling, or marketing before small problems scale into big ones.
When a single service really is the answer
There are practices where one service clearly stands out as the best marginal investment: a practice with heavy restorative volume will often find in-house CAD/CAM crowns to be the single most profitable service; another with a strong recall base and minimal external referrals may find expanding hygiene to be the highest-yield move; a practice in an affluent suburban market might see aligners or implants pay off fastest. The key phrase here is “fit”: the service that suits your demand, staffing, capital and marketing strengths becomes the winner.
Practical next steps: a 90-day plan
Try this short-plan to test a new service with limited risk:
- Select one service to test using the ROI checklist above.
- Run a four-week pilot with 8–12 patients or procedures.
- Track contribution per clinical hour and marketing cost per accepted case.
- Refine pricing, scheduling and staffing after week four.
- If results meet your threshold, scale; if not, pause and reassess.
Pilots reduce risk and build momentum for successful launches.
Final decision rule: align clinical, operational, and financial fit
Ask three simple questions when deciding on a new service:
- Does the service align with the clinical strengths of my team?
- Can we deliver it efficiently without disrupting high-value chair time?
- Will it add predictable contribution per clinical hour after accounting for acquisition costs and amortized capital?
If the answer is yes to all three, you likely found the most profitable dental service for your practice — at least for the next 12–24 months.
Resources and tools to help
Use a simple spreadsheet with these tabs: production by service, chair time per service, direct costs per service, amortized capital costs, and marketing cost per accepted case. Update monthly and use rolling three-month averages for better stability. If you don’t have time, a brief strategic audit from a focused partner can speed things up and save mistakes. See the agency homepage for additional context: Agency VISIBLE.
Ready to test which service will boost your margins?
Ready to test your next move? If you want a quick, practical audit that maps your production and identifies the likely profit winners for your practice, get in touch with Agency VISIBLE for a short, actionable plan that fits small and mid-sized practices.
Three final practical tips
1. Protect and expand hygiene — it’s your predictable base.
2. Reclaim refer-out procedures where you have the volume and training.
3. Treat elective services as internal-first offers — market to patients you already serve before overspending on external acquisition.
Good decisions come from steady testing, measurement and honest conversations with the team. When fit, the right service will reliably move your margins in the direction you want.
Expanding hygiene capacity often improves profits fastest because it requires low capital, has low variable costs, and delivers predictable production. For many practices adding a hygiene chair or increasing hygiene visits shows a rapid, reliable lift to contribution margin per clinical hour compared to capital-intensive services that take longer to ramp.
Not always. Implants often produce high revenue per case and can be highly profitable when restorative workflows are kept in-house and case volume is consistent. However, implants require capital, specialized training and marketing to attract suitable candidates. If those factors aren’t aligned, implants can take longer to contribute positively to net margins than lower-capital options like hygiene expansion or in-house endodontics.
Run a 90-day pilot with conservative case volume projections. Use an ROI checklist: estimate revenue per case, subtract direct costs and amortized capital, compute contribution per clinical hour, and measure cost per accepted case for marketing. Track results weekly and adjust scheduling, pricing and staffing before scaling. If you want objective help building that pilot, a short audit from Agency VISIBLE can clarify marketing cost assumptions and conversion forecasts.
References
- https://www.planetdds.com/wp-content/uploads/2025/03/2025-Dental-Industry-Outlook-Planet-DDS.pdf
- https://dojobusiness.com/blogs/news/dental-practice-industry-statistics
- https://blog.dentalprice.ai/dental-implant-clinic-performance-metrics-in-the-united-states-2023-2024/
- https://agencyvisible.com/contact/
- https://agencyvisible.com/projects/
- https://agencyvisible.com/
- https://agencyvisible.com/perspectives/