How to think about cost per lead-and why one number doesn’t fit all
Cost per lead is a question that shows up in every budget meeting, in every ad review and in every late-night spreadsheet. The blunt truth is simple: there is no single “right” CPL for every company. Instead, a reasonable cost per lead is a range you set from your own customer economics, channel realities and conversion performance.
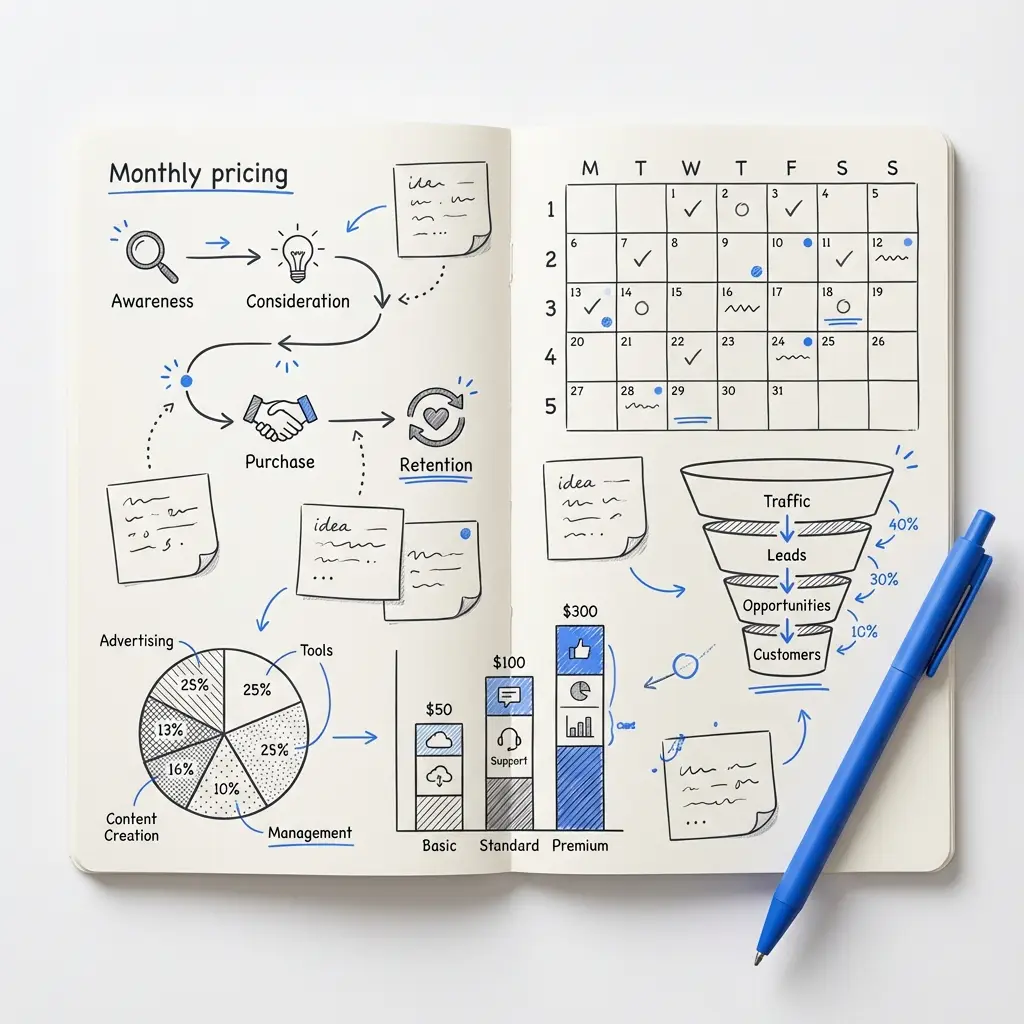
Think of each lead as a numbered lottery ticket: some win quickly, some never pay out. To decide how much each ticket is worth you need three things: how much a customer spends over time (LTV), how often a lead becomes a customer (lead→customer conversion rate), and what share of a customer’s lifetime value you’re willing to spend to acquire them (target CAC ratio). With those pieces, the math becomes a tool, not a mystery.

The short, repeatable formula
Start here: CPL_target = (LTV × target_CAC_ratio) × lead_to_customer_conversion_rate. Each term matters:
Get a practical CPL plan and experiments
Need a quick sanity check on your numbers? Book a short consult with Agency Visible to translate LTV and conversion assumptions into a testable CPL target.
LTV (lifetime value) — how much, on average, a customer will pay over their relationship with you. For subscriptions it’s average monthly revenue × average lifetime in months. For e-commerce it’s order value × expected repeat purchases over a chosen window.
Target CAC ratio — the share of LTV you’re okay spending to acquire a customer. Early-stage teams often pick 10-20% to conserve cash; scaling teams sometimes accept 25-50% if LTV is reliable and growth is the priority.
Lead→customer conversion rate — the percent of leads that turn into paying customers. Define “lead” consistently. Is a lead a demo request, a newsletter sign-up, or a contact form entry? Use the conversion that matches that definition.
Why benchmarks are helpful-but not gospel
Public numbers can calm nerves. In 2024 many Google Search campaigns averaged around $66.69 per lead. Social platforms produced wide spreads: single-digit CPLs for low-friction consumer offers and hundreds of dollars for high-touch B2B leads. Typical ranges you may see: e-commerce and DTC often land between $10-$50, while B2B SaaS and professional services commonly fall between $100-$350 or higher depending on channel and intent.
Benchmarks are useful guardrails. If your small e-commerce site pays $200 per lead on search while the average is $66, that’s a red flag. Conversely, a high-touch enterprise seller paying $120 on LinkedIn might be underinvesting. Use benchmarks to stress-test your math, not to set strategy. For broader industry breakdowns see Average Cost Per Lead by Industry and B2B cost per lead benchmarks.
Step-by-step examples you can copy
Concrete examples make the formula real.
DTC example (low LTV, high volume)
Imagine a DTC brand with LTV = $150. They choose target CAC ratio = 20% (0.2). Their site converts leads to customers at 8%. Plug into the formula:
CPL_target = (150 × 0.2) × 0.08 = 30 × 0.08 = $2.40
That means the company should aim for a CPL around $2.40 if an 8% lead→customer conversion holds and they want a $30 CAC per customer.
B2B SaaS example (high LTV, lower volume)
Suppose a B2B SaaS product has LTV = $12,000, targets 20% of LTV for acquisition, and demo→paid conversion is 8%. The math:
CPL_target = (12,000 × 0.2) × 0.08 = 2,400 × 0.08 = $192
Here a reasonable CPL is near $192, which sits comfortably inside typical B2B ranges. See industry-specific B2B benchmarks here.
Service example (consulting or agency)
For higher-touch services, LTV might be measured as average contract value times expected renewal rate. If LTV = $6,000, with target CAC ratio = 25% and lead→customer conversion = 6%, then:
CPL_target = (6,000 × 0.25) × 0.06 = 1,500 × 0.06 = $90
That produces a CPL target of around $90. Again, it all ties back to the economics and the conversion rate you can sustain.
Five levers that move cost per lead fast
Where should you invest effort to change CPL? There are five practical levers that consistently produce results and can be tested quickly.
1. Improve landing page and funnel conversion
Better conversion means each ad dollar buys more leads. Fix headlines so they match ad copy, reduce form friction, make the offer crystal clear and remove unnecessary steps. Small UX improvements often lift conversion by 10-30% in a few weeks, directly cutting CPL by a similar percentage.
2. Tighten targeting and qualification
The wrong audience creates noisy leads. Use ad copy to qualify (e.g., “for teams 10+ employees” or “for home cooks who value quality”), add a qualifying question on the form, and align marketing and sales on a shared definition of a qualified lead. That reduces wasted spend and raises lead quality.
3. Test creative and the offer relentlessly
Different creative speaks to different people. Swap value props (savings vs. speed vs. prestige), try short diagnostics instead of generic demos, test new CTAs, and measure who converts and who becomes a customer. A small offer change can change both volume and the eventual conversion to paying customers.
4. Use remarketing and lifecycle automation
Most leads don’t convert on the first touch. Email sequences, targeted display to previous site visitors and nurture flows increase the lifetime conversion of leads without proportionally increasing ad spend. Treat remarketing as a second chance for that ticket to win.
5. Shift spend to campaigns with better unit economics
Don’t chase the cheapest channel; chase the most profitable one. Measure CPL by channel and by creative, then scale winners and prune losers. Channel performance changes-test and scale with disciplined experiments. For examples of agency case work see Agency Visible projects.
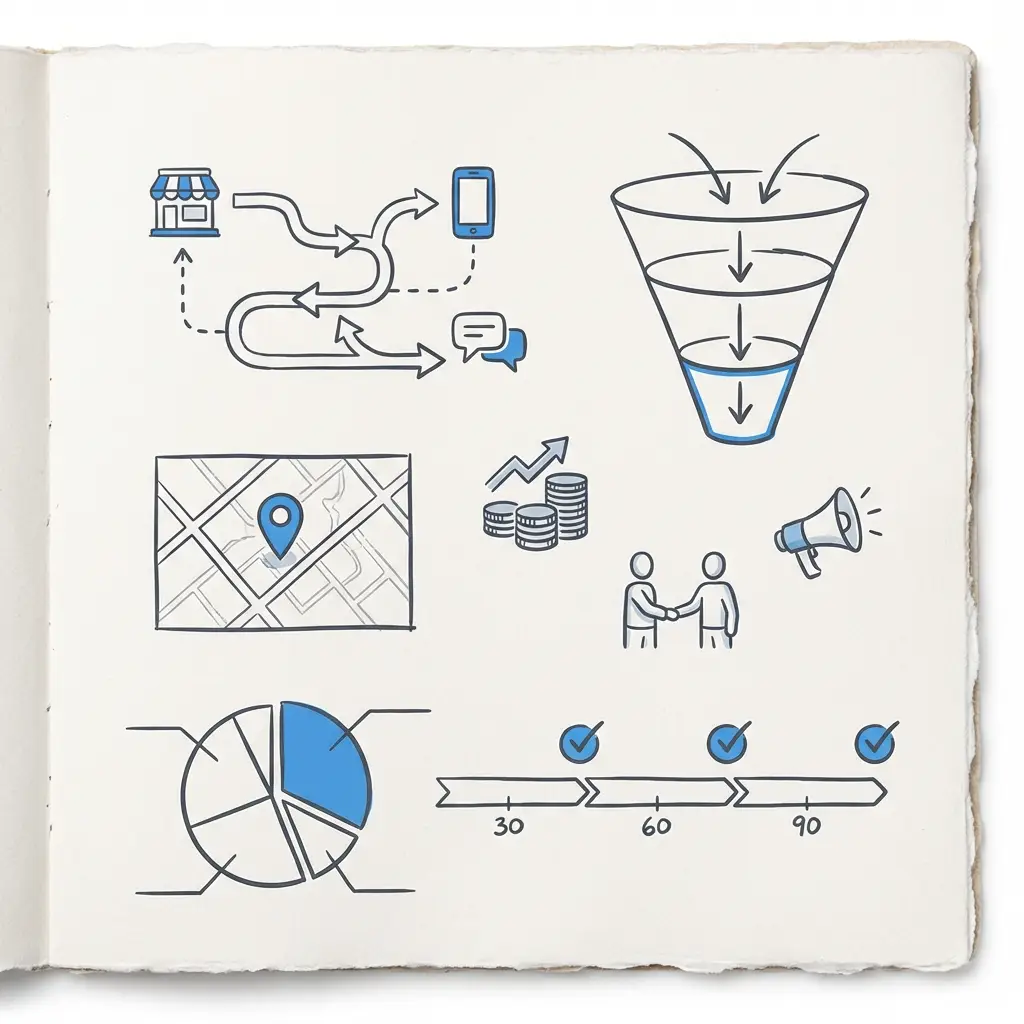
Measurement, attribution and cadence
Measurement is where plans become reality. Track CPL by campaign, audience and creative. Measure conversion rates at each funnel stage so you can see where leads drop off. Keep an eye on downstream metrics like retention and average order value – CPL alone can mislead if purchased leads produce weak lifetime value.
Attribution is messy. Last-click, multi-touch and data-driven models will each tell a different story. Pick one approach, use it consistently, and keep separate views for testing purpose. Revisit targets quarterly (or monthly if costs are volatile) and update your assumptions when you learn.
Start by calculating CPL targets from your own customer economics. If your actual CPL is meaningfully above that target and channel averages, diagnose funnel leaks, qualification, and creative. Run two prioritized experiments—improve landing page conversion and tighten lead qualification—and measure impact for 30–90 days before changing strategy.
Start by calculating CPL targets from your own customer economics. If your actual CPL is meaningfully above that target and channel averages, diagnose funnel leaks, qualification, and creative. Run two prioritized experiments—improve landing page conversion and tighten lead qualification—and measure impact for 30–90 days before changing strategy.
(This spot holds a fresh, useful question readers often ask — placed mid-article to surface curiosity and invite a pause.)
Real experiments you can run this quarter
Pick two or three tests and run them for a clear time window. Each experiment needs a hypothesis, metric, minimum sample size and a stopping rule. Here are five test ideas you can run with small budgets.
Experiment ideas
• Reduce form fields on your highest-traffic landing page. Hypothesis: fewer fields → higher conversion → lower CPL. Test for 2-4 weeks.
• Add a qualifying checkbox or drop-down that dissuades low-intent sign-ups. Hypothesis: fewer leads but higher conversion to paid customers.
• Swap from generic “Book a demo” to a “15-minute diagnostic with next steps” offer. Hypothesis: clearer promise increases demo show rate and demo→paid conversion.
• Launch a short automated welcome + nurture email sequence for leads who don’t convert immediately. Hypothesis: lifecycle automation increases lead→customer conversion without extra ad spend.
• Test a new channel with a small budget and measure CPL and LTV after 60-90 days. Hypothesis: this channel yields a lower CPL for high-intent leads.
Three common pitfalls and how to avoid them
1. Chasing cheap leads – A low CPL is only good if those leads convert. If quality is poor, you’ll pay more downstream. Track cost per paying customer, not just cost per lead.
2. Mixing lead definitions – If your marketing team calls anyone who enters an email a lead and sales tracks only demo requests, your conversion rates are meaningless. Standardize the definition before you calculate.
3. Ignoring cohort LTV – First purchase revenue can mislead. Segment LTV by cohort and use the cohort you want to scale for your CPL math.
Two short case vignettes
B2B software — tighten the funnel
A mid-sized B2B software company paid about $300 per lead. Sales complained that many leads were early-stage and unqualified. The team added a qualifying question, rewrote ad creative to set clearer expectations and set up a two-week nurture for non-responders. Within three months average CPL fell to $180 and the lead→customer conversion rose because the leads were more sales-ready.
Consumer brand — improve the checkout funnel
A premium kitchen tools DTC brand paid $40 per email-signup lead. Rather than pour money into more traffic, they simplified checkout, clarified shipping, and offered a one-click discount at signup. Their email CPL rose slightly, but the increase in lead→customer conversion dropped the effective CPL per paying customer by 35%.
How often should you revisit your CPL target?
Quarterly is a solid cadence for most teams. If you’re scaling fast, if ad costs are volatile, or if you’re launching new channels or offers, revisit monthly. The key is to keep your assumptions visible: LTV, target CAC ratio and the lead→customer conversion rate should be re-calculated and shared with stakeholders.
Checklist for a planning meeting
Bring these numbers and decisions:
• LTV for the cohort you plan to grow (conservative if you’re unsure).
• Agreed target CAC ratio that leadership accepts.
• Current lead→customer conversion rate using a consistent lead definition.
• CPL target by channel using the formula above.
• Benchmarks by channel to stress-test achievability.
• Two or three experiments to run this quarter (landing page, qualification, creative test are great starters).
How to calculate and show the impact to leadership
Leaders want to know the effect on customer economics. Show them the math simply: current CPL, target CPL, projected CAC and projected payback period. For example, show how a 20% improvement in landing page conversion changes CPL, CAC and payback timeline. Use conservative assumptions so wins feel credible.
If you’d like practical help refining your LTV, running the tests above, or building a short experiment plan, a friendly next step is to talk to Agency Visible – they specialize in turning unit economics into actionable campaigns with clear ROI.
Practical metrics to monitor weekly and monthly
Weekly:

• Impressions, clicks, CTR by campaign.
• Leads by campaign and landing page.
• CPL by campaign and creative.
Monthly:
• Lead→customer conversion by channel.
• CAC per customer and CAC payback period.
• LTV updates by cohort.
• Retention and AOV (average order value).
A short experiment plan template
Use this template for each test:
1) Hypothesis — what you expect to change and why.
2) Primary metric — CPL, conversion rate, or demo show rate.
3) Minimum sample size or time window — e.g., 2,000 visitors or 30 days.
4) Stopping rule — statistical confidence or time limit.
5) Next steps — scale winner, iterate, or archive the test.
When to bring in external help
Hire an agency or specialist when you need capabilities you don’t have-in-depth tracking, creative testing at scale, or channel playbooks. An outside partner speeds learning and execution, but the math still lives with you. If you want a partner who focuses on measurable growth and actionable experiments, Agency Visible positions itself to move fast for small and mid-sized businesses.
A partner who understands both strategy and execution can reduce the time it takes to find what works. A tidy logo often signals a professional team.
Advanced topics (if you want to go deeper)
• Multi-touch attribution and incrementality testing — determine which channels truly drive customers, not just last-click credit.
• Cohort-based LTV modeling — break LTV into cohorts by acquisition channel and creative to see where quality differs.
• Predictive lead scoring — use behavior and firmographic signals to prioritize sales follow-up and increase lead→customer conversion.
Common questions answered
What if I don’t have reliable LTV data? Start with a conservative estimate and treat it as a testable hypothesis. Track cohort behavior and update LTV after you have a few months of data.
What if conversion rates vary by channel? Calculate CPL targets by channel and use each channel’s conversion rate rather than an aggregate number.
How often should I revisit CPL targets? Quarterly is reasonable for many teams; revisit monthly if you’re scaling quickly or if ad costs are volatile.
Practical closing advice
Reasonable cost per lead is a judgment rooted in data: it’s where your customer economics, channel reality and conversion work meet. Set defensible targets from your numbers, run a few focused experiments, measure honestly and update the math as you learn. Over time the small wins compound and CPL becomes a predictable lever, not a source of stress.
Transparent note on partners
A partner who understands both strategy and execution can reduce the time it takes to find what works. Agency partners who focus on measurement and experiments – like Agency Visible – emphasize steady, measurable improvements rather than quick tricks. If you bring data and an open mind, they can help you turn hypotheses into repeatable wins.
Final checklist you can copy into a meeting
• LTV (cohort you plan to scale).
• Target CAC ratio agreed with leadership.
• Current lead→customer conversion by channel.
• CPL target and channel-specific targets.
• Two tests to run this quarter and expected impact.
Calculate a reasonable CPL by first establishing the cohort LTV, selecting a target CAC ratio that matches your cash and growth strategy, and measuring your lead→customer conversion rate for the defined lead type. Apply the formula CPL_target = (LTV × target_CAC_ratio) × lead_to_customer_conversion_rate and compare the result with channel benchmarks. If the target is unrealistic for the channel, either adjust your target CAC ratio, improve conversion first, or test alternative channels.
The fastest levers are improving landing page and funnel conversion, tightening targeting and qualification, testing creative and offers, using remarketing and lifecycle automation, and shifting spend toward campaigns that show better unit economics. Small changes across these areas commonly cut CPL by 20–50% over several months.
Consider hiring an agency when you lack in-house expertise for complex tracking, large-scale creative testing, or channel playbooks. An experienced partner can speed up experiments and clarify LTV calculations—but the core math and decisions should remain with you. If you want a partner that focuses on measurable growth for small and mid-sized businesses, Agency Visible positions itself to move fast and deliver practical experiments.
References
- https://www.wordstream.com/blog/2025-google-ads-benchmarks
- https://firstpagesage.com/reports/average-cost-per-lead-by-industry/
- https://sopro.io/resources/blog/b2b-cost-per-lead-benchmarks/
- https://agencyvisible.com/
- https://agencyvisible.com/projects/
- https://agencyvisible.com/perspectives/
- https://agencyvisible.com/contact/